Market Action During Live Interview with the Options Hunter
Here's why you should act now
Limited Inventory: Seats are filling up fast! We have a limited number of spots available for this exclusive live trading hours experience.
Unbeatable Deal: This is an offer you don't want to miss. You'll get access to 5 full days of live trading sessions, where Dale Wheatley, The Options Hunter will guide you...
QQQ setup March 8, 2024


🌟 Master Options Trading LIVE with Dale for a Full Week in April 2024! 🚀
Exciting News Alert!
Five Full Days in One Week is Back for April 2024
Limited Seats Available!
We're thrilled to announce that we have a limited number of seats available for this amazing 5-day experience! April 22 - 26, 2024. Don't miss out on this opportunity to join us, the last 5-day event in January sold out quickly. Hurry and grab your spot now before they're all gone!
In 2023, our Live Trading Hours Zoom access was restricted to 2 consecutive days. However, we've been actively listening to your feedback. Based on numerous client requests, and the sell-out of January's 5-day event, we are excited to announce that we are once again extending access to 5 consecutive days in April 2024! This enhancement will enable us to maximize opportunities for identifying our MACD divergence setups.
April 22 - 26, 2024 is the Full week With Dale
For this spring event, we're excited to lighten the load on your wallet and make it even...
Fed Day Slam Dunk Options Trade - I saw it coming
“Pay attention” to the short-term charts for “The Pattern” on Wednesday between 1 and 3pm Eastern on SPY
Tuesday January 30, 2024 I mentioned in my live weekly webinar
Did I call it or what?

SPY 5-minute chart at 11.45am Pacific, 2.45pm Eastern
I clearly explained what to expect when the Fed is going to act! I look for chart patterns, same as always! The VXX had a clear upside divergence at 2:45pm EDT that led to every major market selloff! The SPY made 15 times + your money. Brilliant, if I say so myself!! Absolutely incredible!!!

VXX 5 minute chart at 11.45am pacific, 2.45pm Eastern clear divergence up on MACD
Returns on IWM puts did the best but even the SPY did well. Here's the SPY 485 puts that expired January 31, 2024. When the divergence was clear on VXX and SPY, the puts were around 10c. By the last 10 minutes of the day they were trading near $2!!

SPY 485 puts expiring...
Russell 2000 ETF IWM setup December 1. 2023
Well, like I said, I expect (based on the patterns, of course) the markets to break out to the upside! The IWM on expiration day is showing the 184 calls up 100 times from this morning! That’s 10,000%, so far!!

Here are the IWM 184 calls that expired on December 1, 2023. Entry clearly below 10c, and exit when MACD turned down at around the $1 level.

Want to learn how to look for these trades?
You asked and we Listened
Five Full Days in One Week
In the past, our Live Trading Hours Zoom access has been restricted to 2 consecutive days. However, we've been actively listening to your feedback. Based on numerous client requests, we are excited to announce that we are extending access to 5 consecutive days! This enhancement will enable us to maximize opportunities for identifying our MACD divergence setups.
January 22 - 26, 2024 is the Full week With Dale
This holiday season, we're excited to lighten the load on your wallet and make it even more...
$$$ Oct 6 was a slam dunk trading day $$$


Don't miss your chance to save a 20% on our bundled offer that's set to elevate your options trading journey.
eBook #1: Kick-Ass Options Trading
- Fully illustrated with recent price charts, making learning a joyride!
- Clear and concise explanations that demystify complex strategies.
- Explore The Options Hunter's real-world trade setups with in-depth insights and examples that light up your trading path.
Unlock Your Trading :
- Discover your unique trading personality and risk tolerance – because one size fits none!
- Learn the art of crafting trades tailored exclusively for your style.
- The Options Hunter's...
Even on quiet market days there's money to be made
September 19, 2023 another UVXY classic Volatility Setup
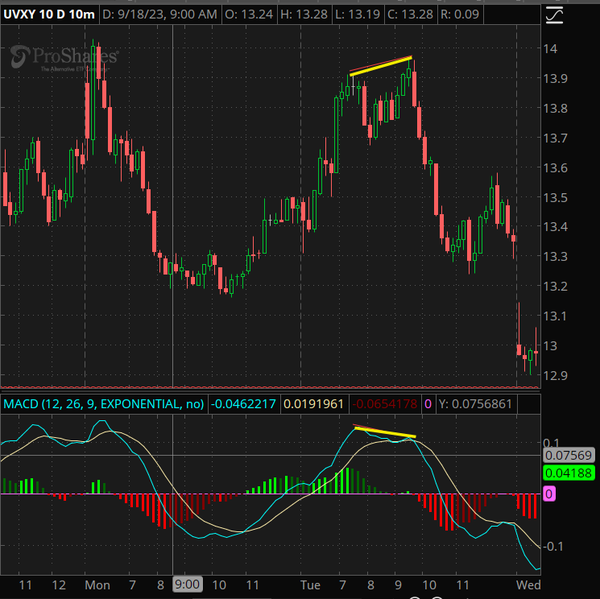
Tuesday September 19, we saw a divergence to the downside on UVXY on the 10-minute chart, indicating Volatility was about to head down despite UVXY prices being at a new high for the day. What Does This Mean? The markets are likely headed higher..
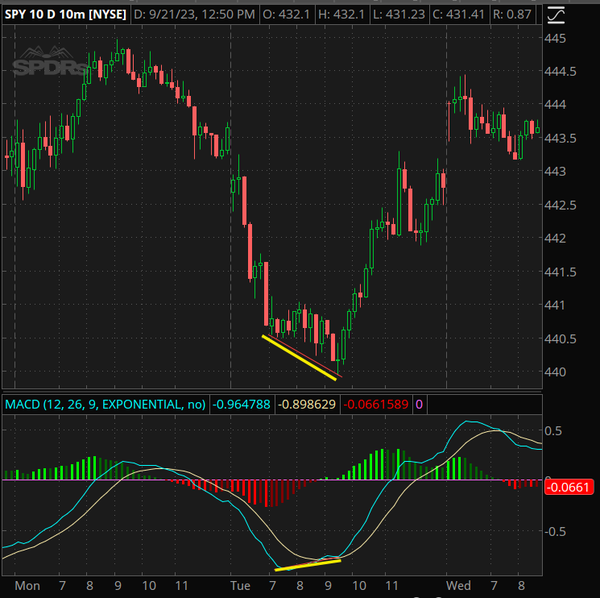
The SPY 10-minute chart below shows us the MACD divergence up at the same time as the UVXY is doing the opposite. This provides us more momentum to the move thats coming.
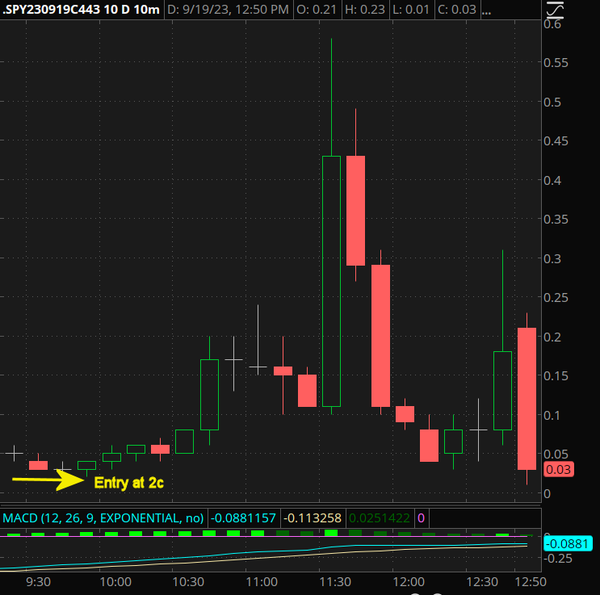
That upside divergence on SPY gives us confidence that the markets are likely to move higher. In the chart below we Selected OTM calls on SPY expiring the same day 9-19-23, the 443 calls gave us an entry for @2c.
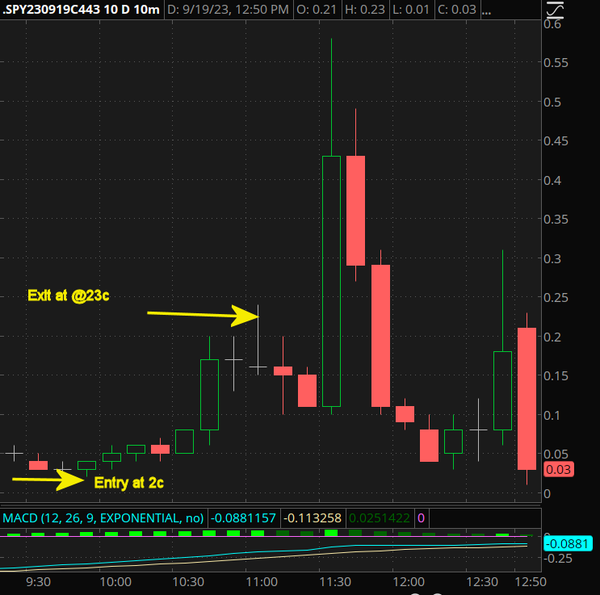
The MACD on the SPY 10-minute chart below turned down around 90 minutes into the trade. We could exit at around 23c for a nice 10 times your money.
.
The SPY 10-minute chart below also gives us a possible reentry point...
The UVXY tells us there's money to be made
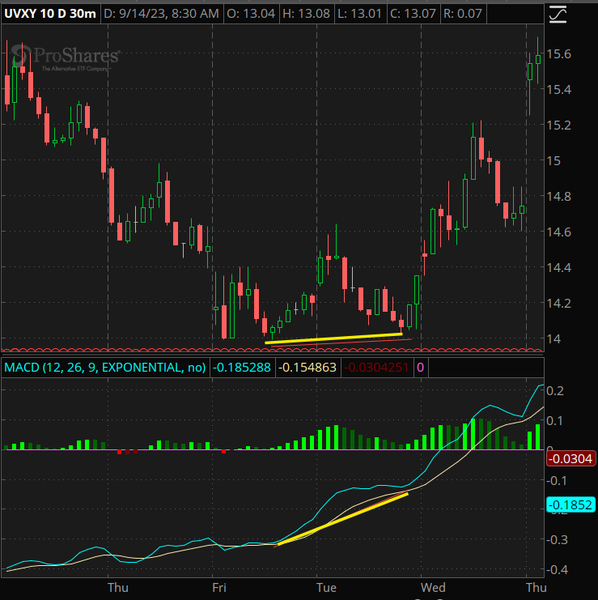
Dale tweeted about the September 5, 2023 action on UVXY
"See, you cannot WAIT for the price to move! You’ve got to believe in the charts and what they say about the price! Does it belong higher or lower? Not, where it is!! What did the 30 min UVXY chart say yesterday late in the day?? Did the lower time frames confirm it???"
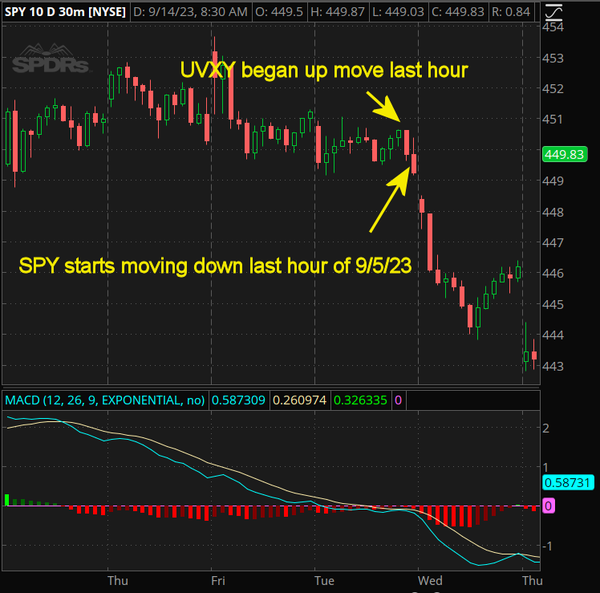
UVXY began moving up sharply the last hour of the trading day 09.05/23. We know this increase in volatility can lead to a fall in the markets. In that last hour of trading, SPY began moving down.
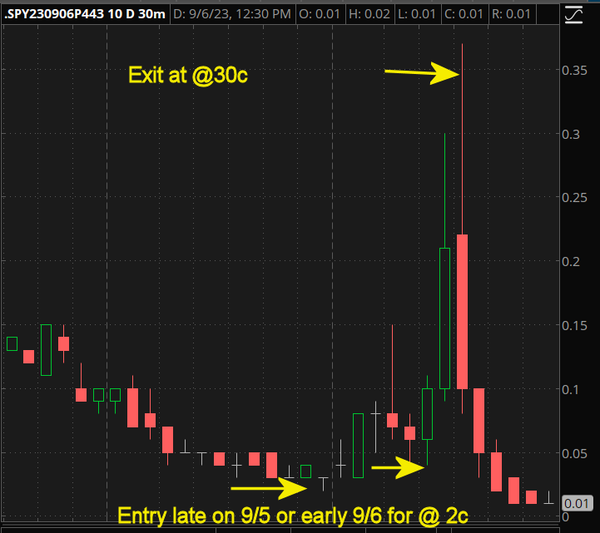
Selecting OTM Puts on SPY expiring on 09/06/23, the 443 Puts could be picked up for @2c late on 09/05/23 or early on 09/06/23. These Puts moved up to @30c exit within 3 hours for 10x your money.
Even on quiet market days there's money to be made
Take July 19, 2023. On the 15-minute chart of the UVXY, the technical picture had been getting higher while the price was generally lower. Notice the early precipitous climb in UVXY as a consequence of the early trading on 7/19/23.
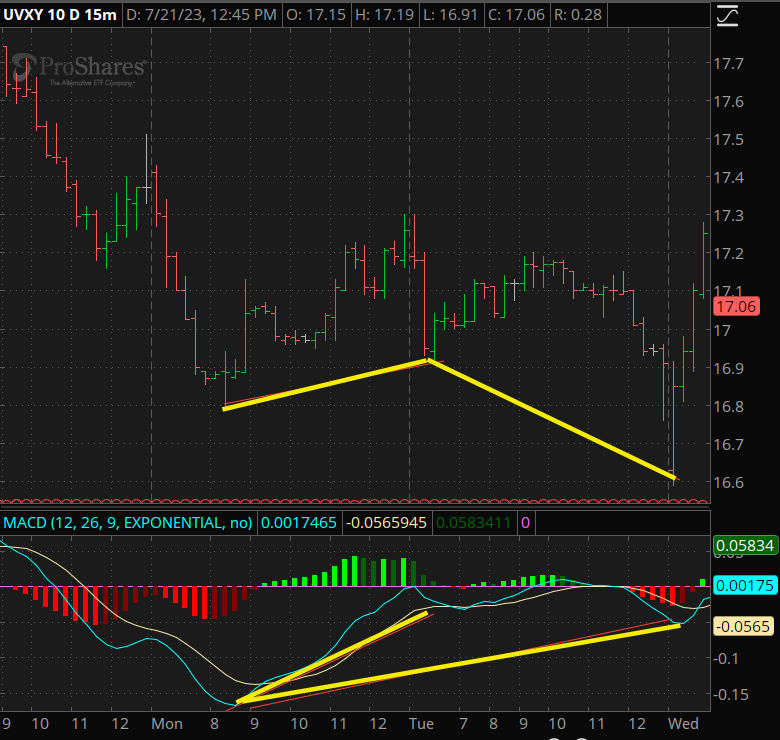
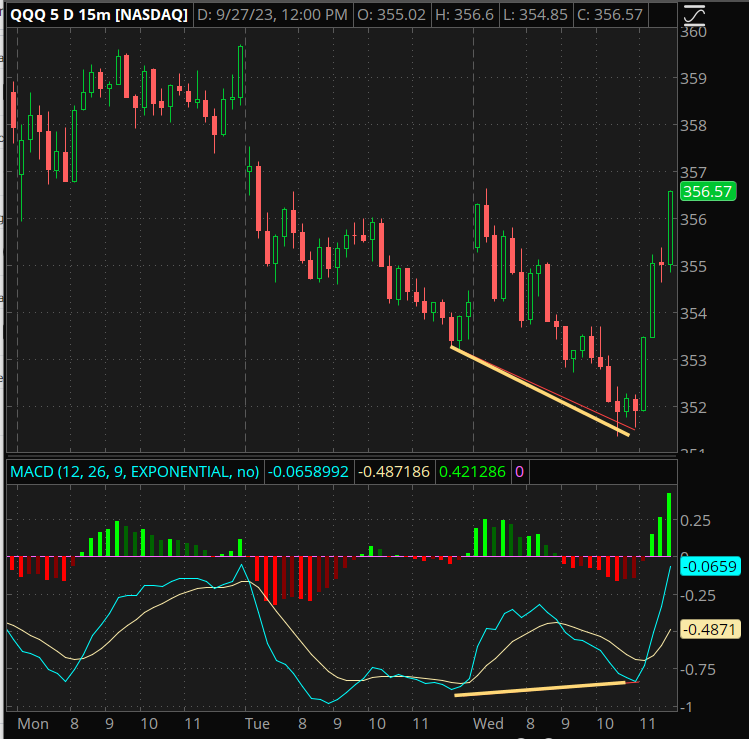
This picture suggests increased volatility and an opportunity for us to look at puts on the major market ETFs during the morning of 7/19/23. Looking at the QQQ during that morning period, the pattern is not perfect but there is a definite divergence in place on the MACD.
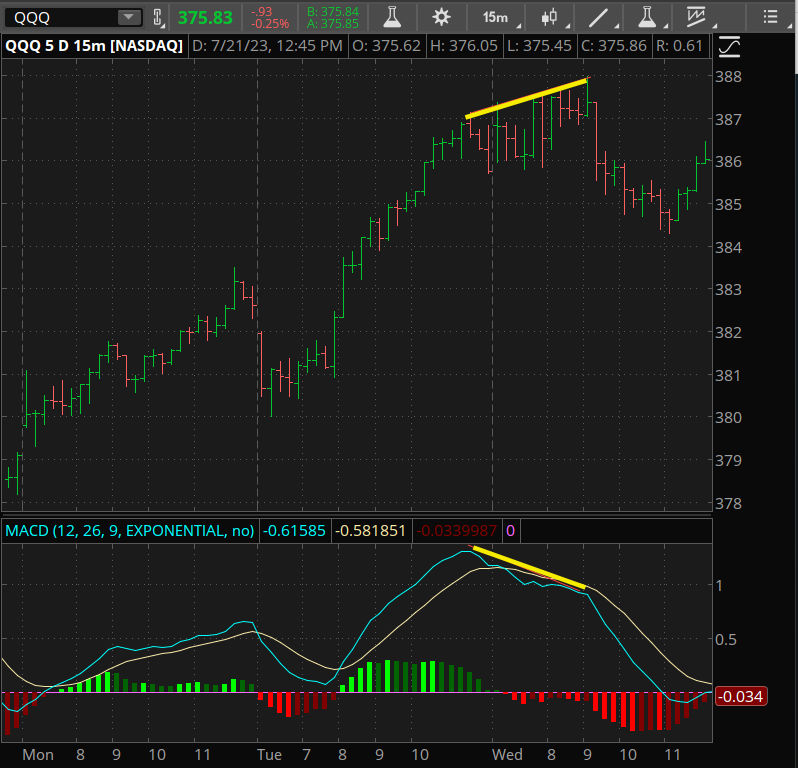
Nimble traders buying the QQQ 383 calls expiring that day, 7/19, could be had for around 7c. Exit within 60 - 75 minutes for around 30c. for 4 times your money. Not our best pattern ever but still not bad.
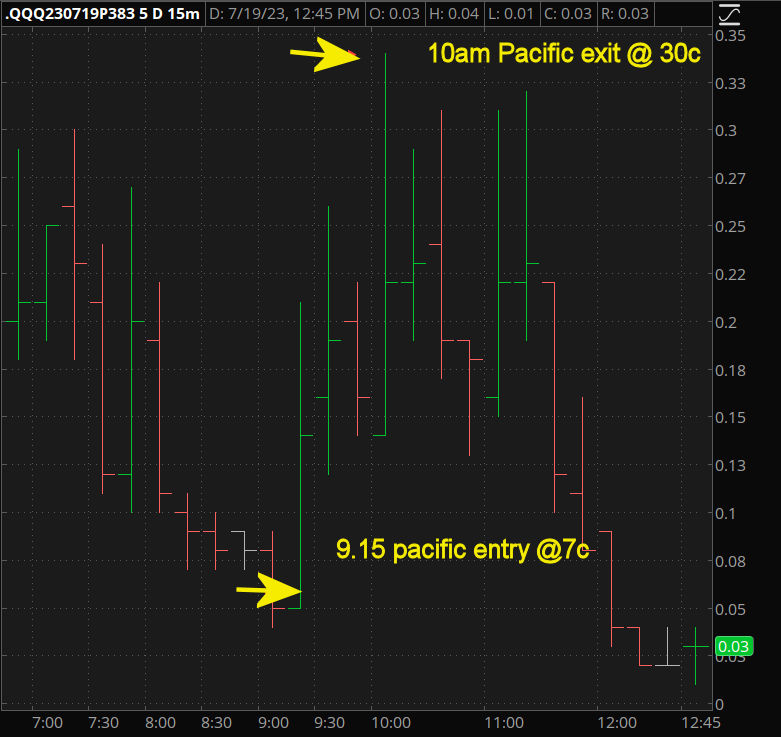 You can see later that same day that the MACD fell in line with the move down on the QQQ and our puts gained in value. Once we exited as technicals turned around, you can clearly see MACD failed to break the Signal Line and turned back down at the end...


