WalMart WMT hourly divergence December 8, 2021
We were watching several stocks towards the end of day on December 7, 2021. WMT was setting up a nice hourly divergence between the MACD and the price action. As prices bottomed in the morning of December 8, 2021, the turn up in the lower timeframes occurred around 13:00.
Given the strength of the divergence, and the slope of the MACD, we looked at WMT out-of-the-money 145 calls to expire on December 10, 2021. Acquiring them at 8c, the options went nowhere fast, and the downturn into the following morning, if you rode it out, came to fruition by the end of the expiration day with the price soaring to over $1.
There was also a reentry point on the same option around 10.30 eastern on December 9, 2021 with price at around 4c for the call.
Here's what the option looked like. all the action took place at the end of the day on the 10th.

The Options Hunter approach focuses on divergences between the MACD and the price action. We don’t employ...
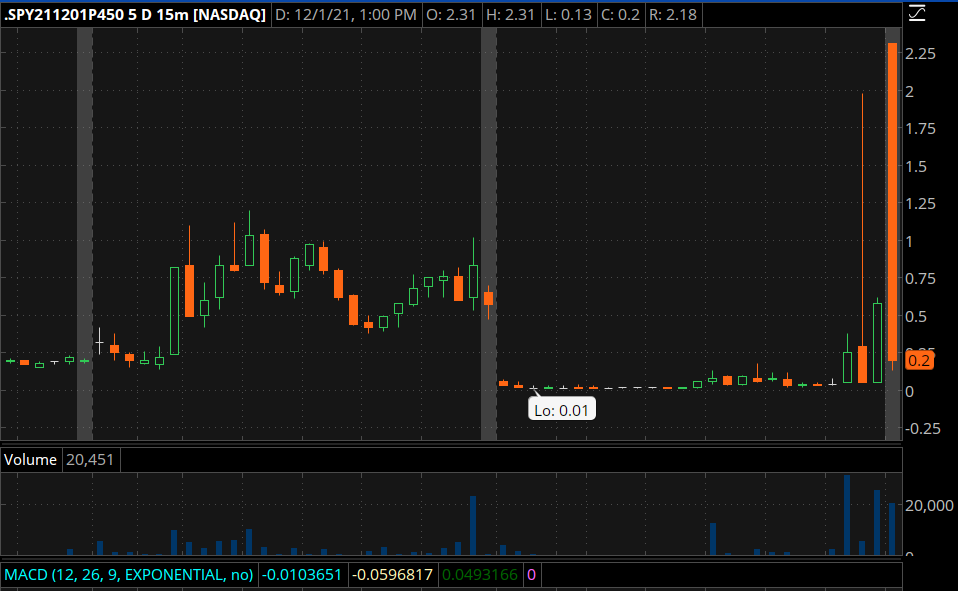
SPY 450 puts that went from .01 to 2.20 in a matter of hours
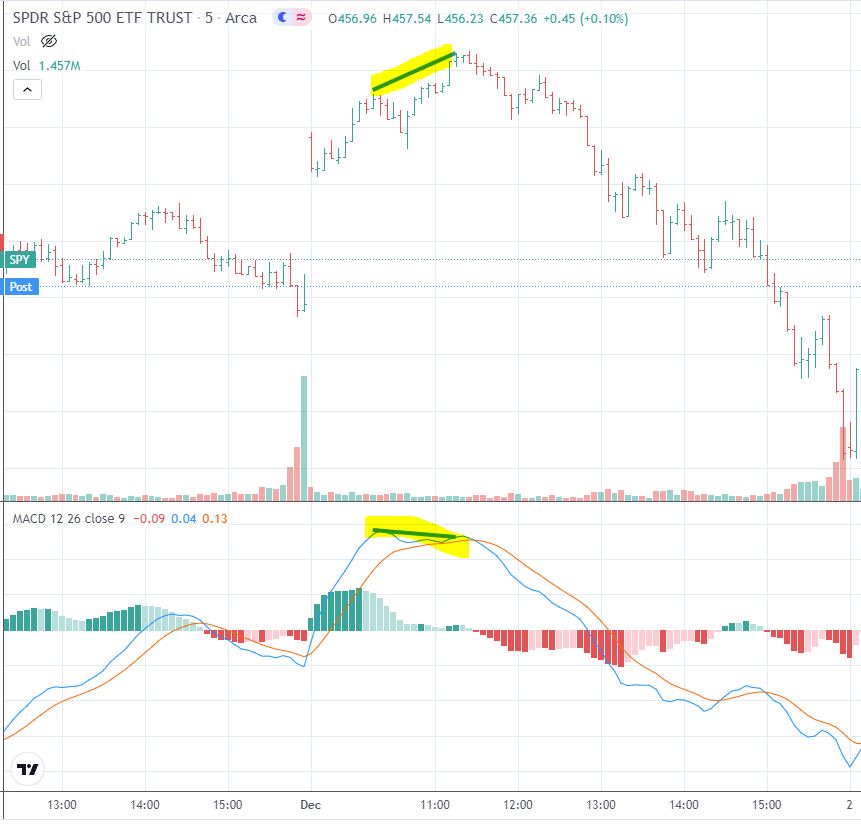
How about that Monday turn around, did you see that coming? We went from the low on November 30 up by 2% on the SPY by 11.15am eastern. Were we wary? yes. Our daily SPY and weekly charts on SPY are still on an MACD divergence down. Sure enough when the 5 min timeframe diverged down right at 11.15am. We were ready to strike.
Check out the SPY 450 puts that went from .01 to 2.20 in a matter of hours.
https://www.theoptionshunter.com/2021-sale-page-v2
The Options Hunter approach focuses on divergences between the MACD and the price action. We don’t employ other indicators such as RSI, Stochastics or Bollinger bands as we keep our approach simple, straightforward, and repeatable
What are Weekly Options and Why Do I use them.
Weekly options are a great way to make money, but it can also be incredibly volatile. Trading weekly should only really be considered for experienced traders who know what they're doing because there is no guarantee that any profits...
Did you see the Black Friday crash coming? We did & you can too
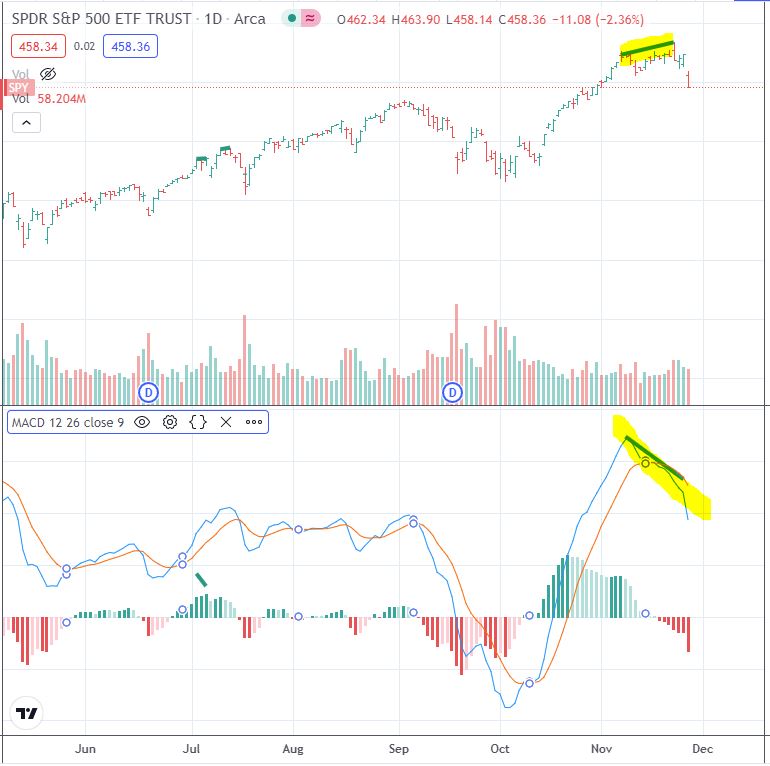
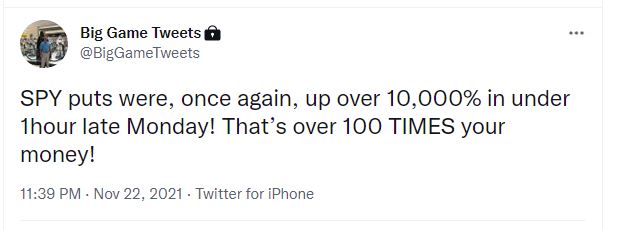
I hate to say I told you so, but we've been on a strong downside divergence on SPY for days. This daily chart says it all. I've tweeted to my Big Game subscribers about the SPY puts that gained 10,000% on Monday November 22, 2021.
P.S. If you want these types of insight into the market BEFORE they happen there's a deal here for you!
https://www.theoptionshunter.com/2021-sale-page-v2
The Options Hunter approach focuses on divergences between the MACD and the price action. We don’t employ other indicators such as RSI, Stochastics or Bollinger bands as we keep our approach simple, straightforward, and repeatable
What are Weekly Options and Why Do I use them.
Weekly options are a great way to make money, but it can also be incredibly volatile. Trading weekly should only really be considered for experienced traders who know what they're doing because there is no guarantee that any profits will even exist in the first place!
How do Weekly Options Differ from...
Zoom classic MACD daily divergence in early August

Daily Bullish MACD Divergence -Trade Analysis ZM August 5, 2021
The Options Hunter Approach is based on four distinct aspects
Step 1: Divergences in technical indicators warn that the current trend is losing momentum in the short term. The stock or index is making new highs or lows, and the MACD indicator does not confirm new highs or lows, which is known as a divergence.
Macd Divergences can be Bearish or Bullish and signals to option traders a potential opportunity for extraordinary gains. Divergences can occur in any timeframes and with many indicators, but we’ll address multiple timeframes in-depth shortly.
The Options Hunter approach focuses on divergences between the MACD and the price action. We don’t employ other indicators such as RSI, Stochastics or Bollinger bands as we keep our approach simple, straightforward, and repeatable
Daily Chart ZM August 5, 2021
In this example, we’ve identified...
IWM strikes again August 20 and 27, 2021

Daily Bullish MACD Divergence -Trade Analysis IWM August 20, 2021
The Options Hunter Approach is based on four distinct aspects
Step 1: Divergences in technical indicators warn that the current trend is losing momentum in the short term. The stock or index is making new highs or lows, and the MACD indicator does not confirm new highs or lows, which is known as a divergence.
Macd Divergences can be Bearish or Bullish and signals to option traders a potential opportunity for extraordinary gains. Divergences can occur in any timeframes and with many indicators, but we’ll address multiple timeframes in-depth shortly.
The Options Hunter approach focuses on divergences between the MACD and the price action. We don’t employ other indicators such as RSI, Stochastics or Bollinger bands as we keep our approach simple, straightforward, and repeatable
Daily Chart IWM August 20, 2021
In this example, we’ve...
The Volatility Index (VIX)

Volatility Index is an innovation that provides options traders with the opportunity to achieve spectacular returns rarely present in other options markets.
The index is based on the implied volatility present in 30-day S&P 500 options. In truly efficient markets, this can reliably be seen as the market’s expectation of near-term volatility. Thus, once the index is created, traders can implement a view of volatility isolated from other variables common to option pricing, such as underlying asset prices, dividends, and even days to expiry.
The VIX’s volatility becomes a tradeable commodity and allows a straight purchase or sale of volatility,
The VIX has a well-defined historical correlation with the S&P. History shows that equity markets rise at a far slower rate than they fall. As such, the historical volatility of the S&P is inverse to its price.
This makes the perfect timing tool for equity markets. When the VIX is low, the markets...
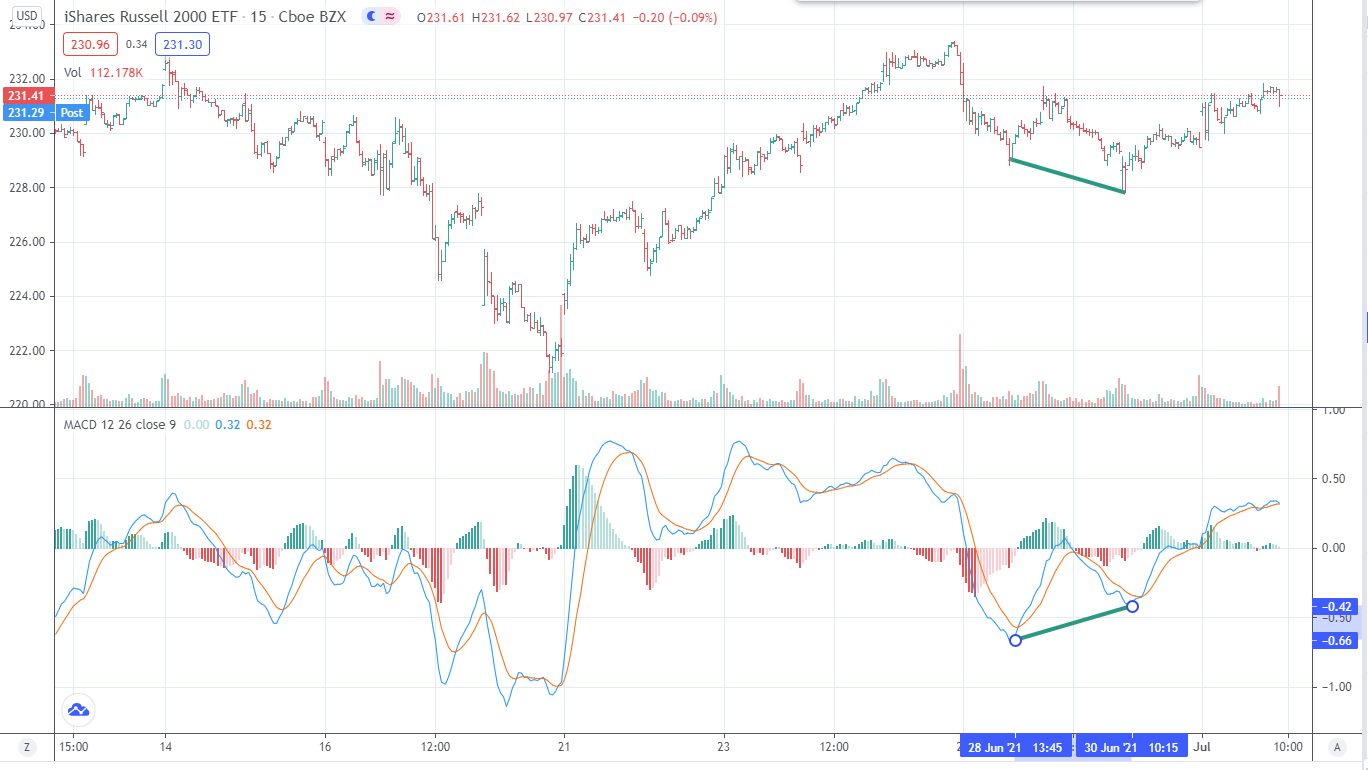
Bullish MACD Divergence -Trade Analysis IWM

Bullish MACD Divergence -Trade Analysis IWM
The Options Hunter Approach is based on four distinct aspects
Step 1: Divergences in technical indicators warn that the current trend is losing momentum in the short term. The stock or index is making new highs or lows, and the MACD indicator does not confirm new highs or lows, which is known as a divergence.
Macd Divergences can be Bearish or Bullish and signals to option traders a potential opportunity for extraordinary gains. Divergences can occur in any timeframes and with many indicators, but we’ll address multiple timeframes in-depth shortly.
The Options Hunter approach focuses on divergences between the MACD and the price action. We don’t employ other indicators such as RSI, Stochastics or Bollinger bands as we keep our approach simple, straightforward, and repeatable
15-minute Chart
In this example, we’ve identified a Bullish Divergence on...
Bullish MACD Divergence -Trade Analysis NIO
Bullish MACD Divergence -Trade Analysis NIO
The Options Hunter Approach is based on four distinct aspects
Step 1: Divergences in technical indicators warn that the current trend is losing momentum in the short term. The stock or index is making new highs or lows, and the MACD indicator does not confirm new highs or lows, which is known as a divergence.
Macd Divergences can be Bearish or Bullish and signals to option traders a potential opportunity for extraordinary gains. Divergences can occur in any timeframes and with many indicators, but we’ll address multiple timeframes in-depth shortly.
The Options Hunter approach focuses on divergences between the MACD and the price action. We don’t employ other indicators such as RSI, Stochastics or Bollinger bands as we keep our approach simple, straightforward, and repeatable
Daily Chart

In this example, we’ve identified a Bullish Divergence on the MACD indicator in a striking contradiction to the...
Interview with Options Expert Dale Wheatley in Traders World

|
| Traders World: What is your background before you started trading options? Dale: I was a Telephone Contractor for many years and needed and wanted an investment vehicle that could travel with me, one that was not too complex. I studied all about different investments such as real estate, buying discount mortgages, tax certificates, etc. as well as the stock market, but none of those things seemed simple enough for me to control myself without a great investment of time and money. I simply did not have much time to devote to those things since I worked 100-hour weeks and moved around the country doing storm reconstruction for telephone companies, etc. I accidentally happened across options in the mid-1980s and I immediately saw the advantage of the limited risk-vs-potential returns. |
TRADERS WORLD: How did you get started in trading options?
Dale: I began trading options in the mid-1980’s. I read every book I could find about options...
Hourly MACD divergence on CVX and XOM reaped 500% next morning

Can't really miss these divergences on the hourly charts of CVX and XOM and picking up the out of the money option before the close on 9/15/20 was perfect timing.
Entry in the last 30 minutes of the trading day as the stocks just started turning up was ideal. The XOM September 18, 37.5 calls could have been had for 11 or 12 c. The next day they were as high as 83c. An alert trader could have taken 500% gain, and with over 2500- 3000 contracts trading a day the spread was reasonable.
The CVX September 18, 79 calls could have been had at a similar time to XOM in last 30 minutes of the trading day for 12c or so. By the next day they traded as high as 1.06. Spread wasn't as nice as XOM as volume was 300 - 500 contracts but again 500% gain was easy to make.


