Monthly MACD Divergence on Retail Sector shows the Way

In spite of the bad news on retailers, I see many with strong monthly MACD chart divergences: BBBY, which I showed weeks ago in class & also LB, BGFV & many others. How can YOU find these before they begin their strong up moves? By doing exactly as I teach!
MACD Divergence show Pressure on the Indexes
With all of the major components like AAPL, MSFT, AMZN down, it must be putting pressure on the indexes that they are a part of & how about Volatility(VXX)? Is is showing any clear upside patterns? What about the short indexes like SPXS & QID? Do we get “confirmation” from these?
VXX 30 minute MACD divergence 7-23-20
SPXS 30 minute MACD divergence 7-23-20
QID 30 minute MACD divergence 7-23-20
MACD Divergence on the VXX is the Trade

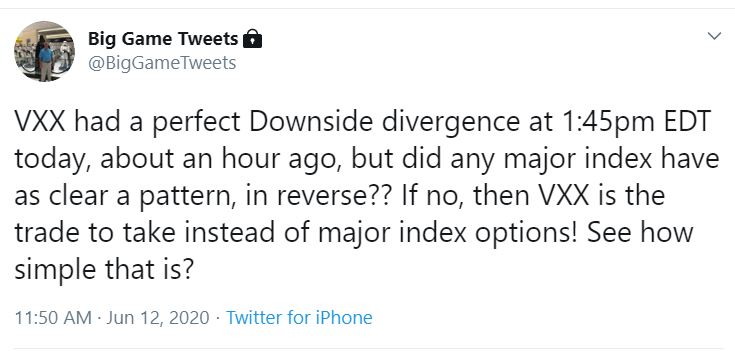
At 1:45pm eastern on June 12 the 5 minute chart on VXX made its way to the high it had reached 2 3/4 hours earlier, but we were concentrating on the MACD indicator. The MACD had a clear divergence indicating that the price action on VXX shouldn't be at $45 but more like $40 or lower based on the slope of the MACD peaks
As predicted the price dropped to below $40. this powerful move down is often reflected with a reverse MACD divergence up on the SPY. In this instance as the chart below clearly shows, there was not one in the offering. So we went back and looked at the VXX puts for big gains on the near term OTM options.
MACD Divergence shows the Way. It ain't rocket science,

So, I'm sure there are many options traders, who are now at home and work, maybe even have a full house of family members. My commitments used to disqualify me from doing intraday options trading, not anymore, now I'm trading on intraday charts looking for MACD divergences and double tops and bottoms like the Options Hunter does.
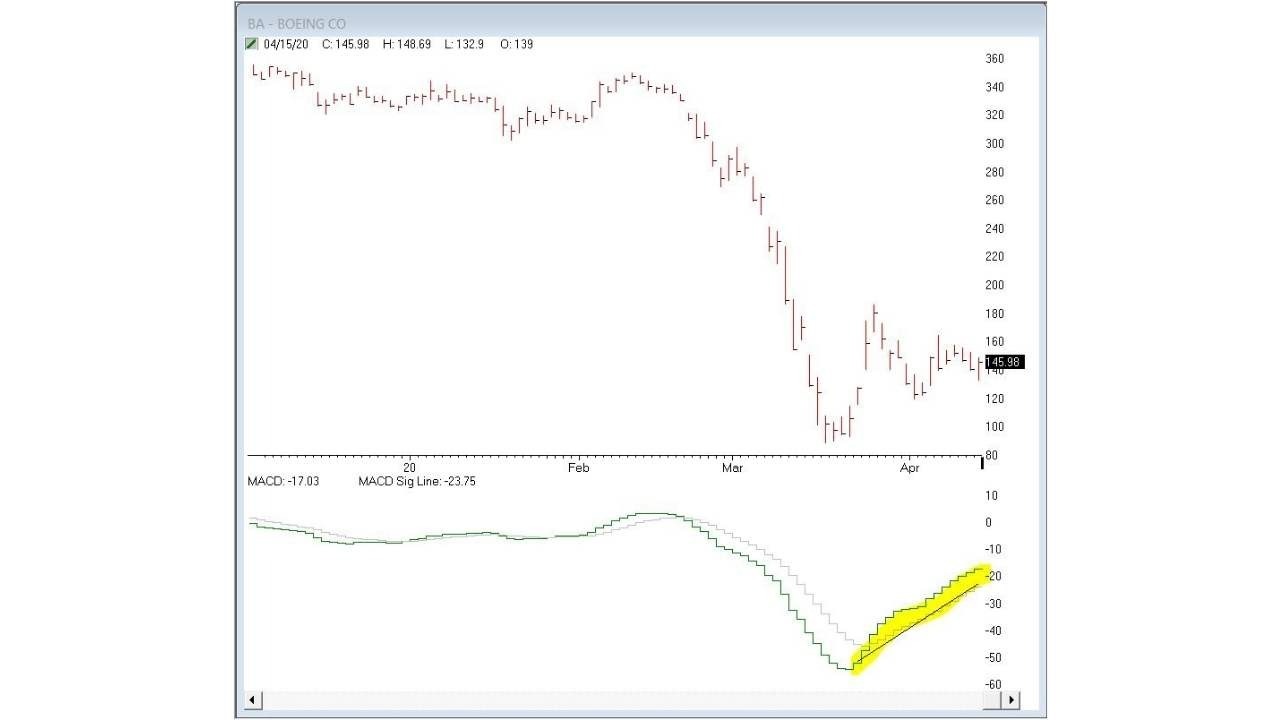
I'm no Dale Wheatley, I'm still learning and cautious with my trades but I can tell you for a fact that this strategy works for me, it really does. The daily chart of BA had a strong MACD up that really gave the confirmation of the 5-minute divergence Dale looks for.
Bullish MACD Divergence on VXX means Markets are Headed Down
| This is a daily chart with a clearly defined UPSIDE DIVERGENCE on VXX, the Fear Index. The time between the first price bottom to the second one, when the divergence occurred, was approximately one month, from late Jan through late Feb 2020. |
| That suggested the up move in VXX and down moves in the major markets and component stocks should last approximately 1 month before the MACD begins to stabilize. Around March 18-20, 2020.
|
| The lower time frames on VXX started showing MACD rolling over and some Downside Divergences, the SPY, QQQ, IWM, XLE, SMH, XLF and most major component stocks then began showing UPSIDE divergences |
| producing huge returns on OTM calls. |
| |
1000% Return on WMT Calls


The daily and hour chart of VXX were the catalyst to turn the markets down on FEBRUARY 19!!


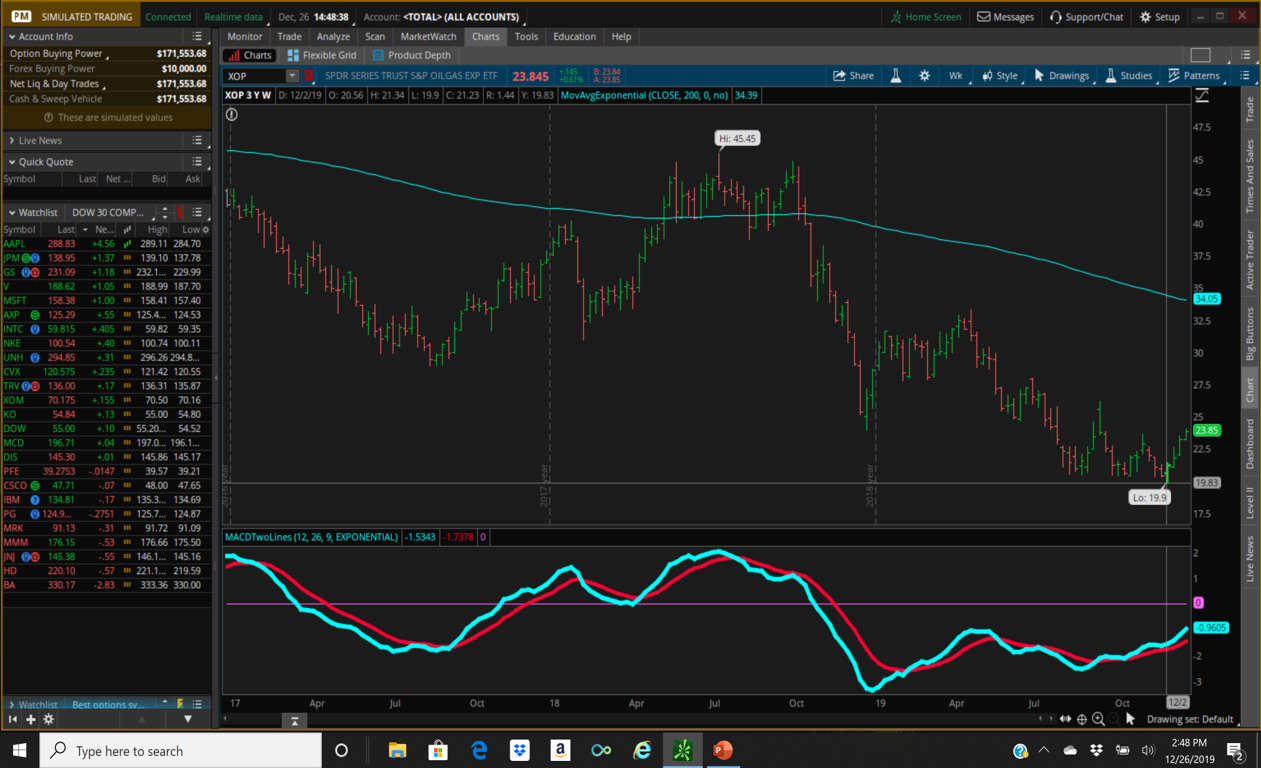
2019 - MACD divergences - XOP

XOP weekly upside divergence on MACD setup with a triple bottom and MACD diverging up.

XOP 23 calls that expired December 27 2019 went from a low of $.05 on December 5, to around $1 on December 26, that 21 days and 2,000%!!

Private Coaching Join me for one-on-one sessions in person
Limited openings available January and February 2020
As your Coach, I fit the training to your needs
-
I’ll show you how to find setups you can trade easily and with total confidence.
-
Get the EDGE that everyone is looking for.
-
Ready to start winning? I'm here to help you take control of your destiny and achieve trading success
-
Whether you want to trade options like a day trader, swing trader, or longer term I can show you how to trade using the MACD divergence and chart patterns.
***** Get 5 hours for the price of 4 *****
https://www.theoptionshunter.com/private-one-on-one-coaching
Dale Wheatley
Founder, The Options Hunter


