MACD Divergence on the VXX is the Trade
Jun 17, 2020
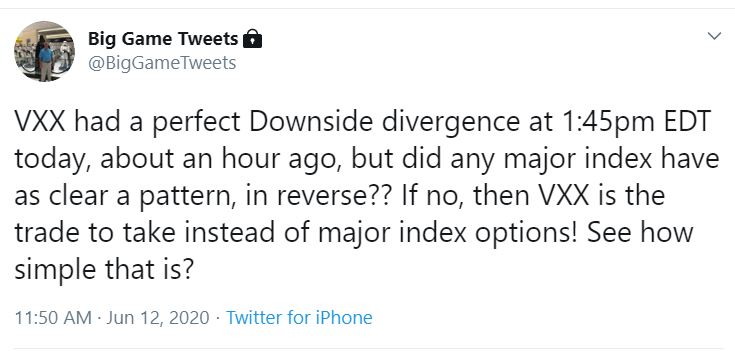
At 1:45pm eastern on June 12 the 5 minute chart on VXX made its way to the high it had reached 2 3/4 hours earlier, but we were concentrating on the MACD indicator. The MACD had a clear divergence indicating that the price action on VXX shouldn't be at $45 but more like $40 or lower based on the slope of the MACD peaks
As predicted the price dropped to below $40. this powerful move down is often reflected with a reverse MACD divergence up on the SPY. In this instance as the chart below clearly shows, there was not one in the offering. So we went back and looked at the VXX puts for big gains on the near term OTM options.


